
Reports
Every figure comes from your own book, with no manual sums. Open them from "More → Reports".
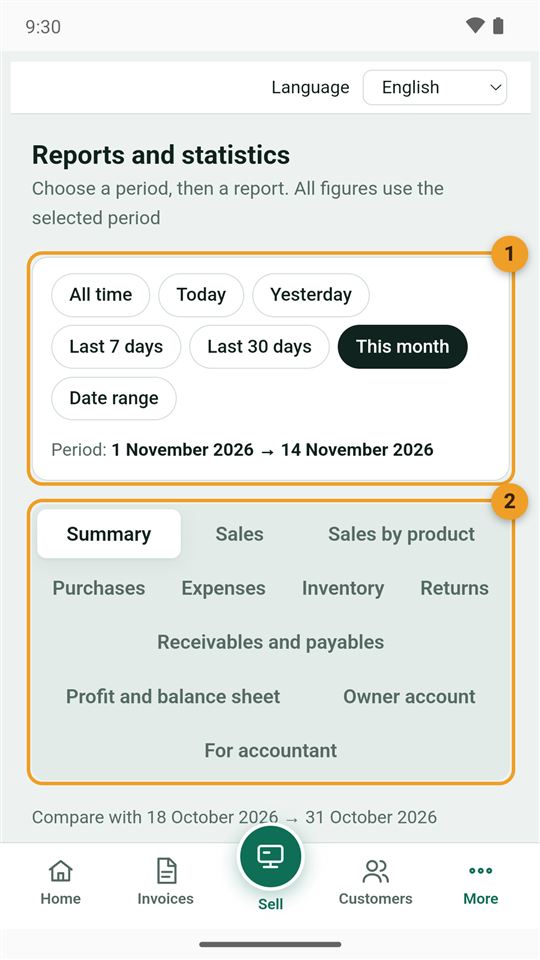
1. Choose the period, then the report
- Period: today, yesterday, last 7 days, this month, or a "Date range". Every figure follows it.
- Reports: summary, sales, sales by product, purchases, expenses, inventory, returns, receivables and payables, profit and balance sheet, owner account, and for the accountant.
In "Simple" mode the accountant's reports are hidden, and stock and purchase reports show only once you use them.
2. Summary
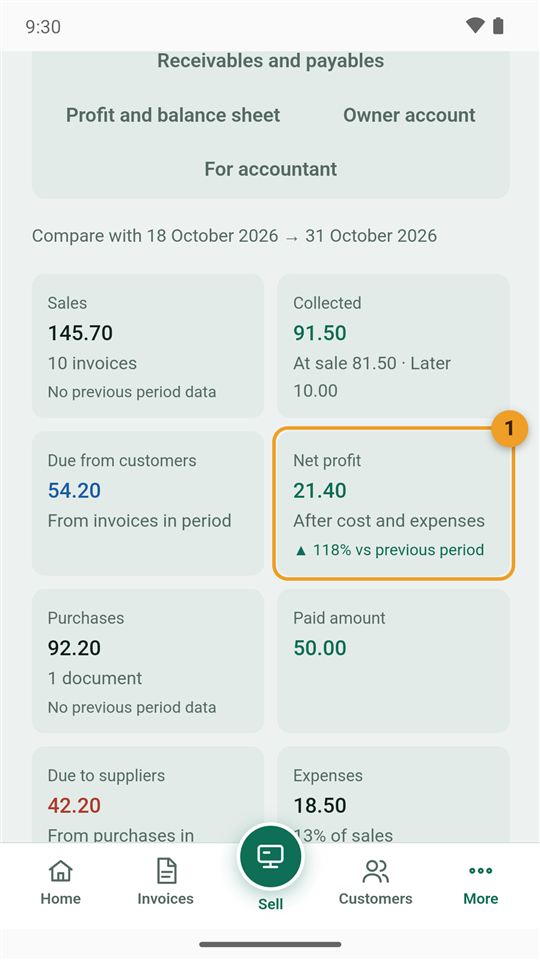
- Net profit after the cost of goods sold and expenses, compared with the previous period.
Around it: sales and number of invoices, collected, due from customers, purchases, and expenses.
3. Sales by product
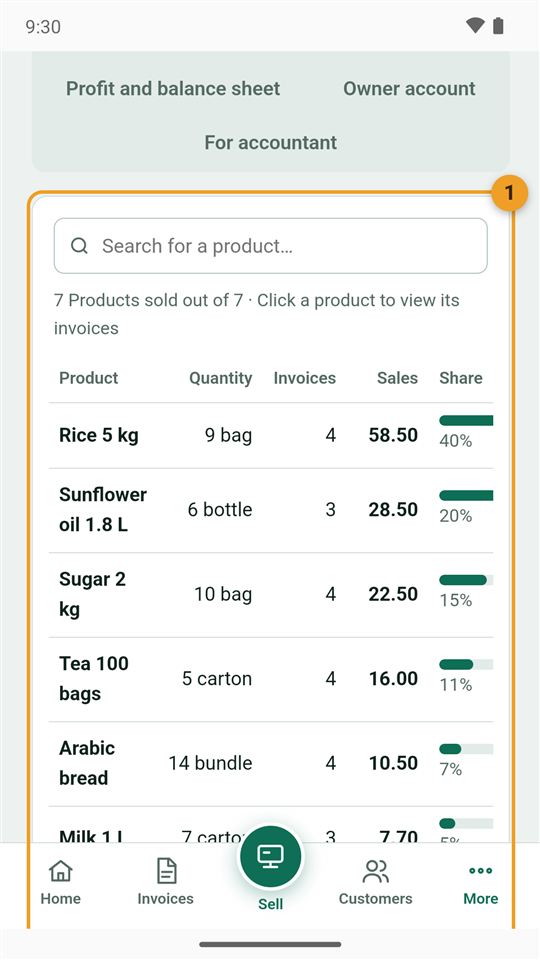
- Each item or service: quantity sold, number of invoices, sales, and its share of your sales. Tap an item to see its invoices.
This shows what sells best, and what deserves more shelf space.
4. Profit and loss
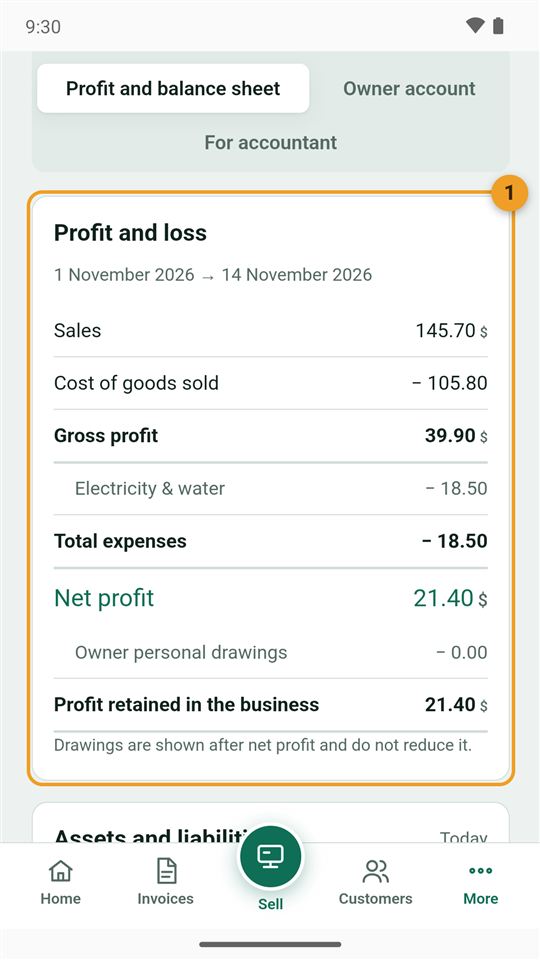
- Profit and loss for the period: sales, minus the cost of goods sold, minus expenses, equals net profit.
The same tab has the balance sheet: what the business owns (cash, stock and customer debts) and what it owes.
The receivables and payables report is explained in the grocery example.
Why is the profit different from the cash in the box? Read How do you know your real profit?